Following our longitudinal study of silent credit contraction, this research explores Behavioral Fatigue Signals as a direct systemic consequence. That earlier analysis showed how automated limit adjustments emerge without explicit triggers. This study extends that conclusion by examining a later-stage inflection point. In 2026 auditing systems, persistent optimization activity itself begins to correlate with elevated systemic risk markers.
In the current credit ecosystem, AI models rely on discrete state recognition rather than linear trend improvement. Therefore, when a profile displays prolonged periods of near-perfect balance control, the system evaluates the pattern itself. Behavioral Fatigue Signals emerge when optimization appears sustained through effort rather than supported by structural cash flow stability.
The Mechanics of Hyper-Optimization as a Risk Marker
From a systemic perspective, Behavioral Fatigue Signals function as indicators of optimization exhaustion. Earlier credit strategies promoted micro-adjustments to influence scoring outputs. However, 2026 auditors evaluate the metadata surrounding those movements. Consequently, repeated timing precision across repayment cycles correlates with elevated friction classifications.
When transactional data shows liquidity injections aligned too closely with reporting boundaries, AI systems interpret the pattern as modeled performance. In contrast, organically stable profiles tend to exhibit minor variance. Therefore, the absence of volatility becomes statistically meaningful rather than reassuring.
This is a general educational framework, not personalized financial advice. We are not a credit bureau, lender, or scoring model provider.
Structural Friction Dynamics and Artificial Stability
Modern auditing frameworks prioritize resilience over surface-level optimization. As a result, systems apply higher sensitivity coefficients to profiles exhibiting artificially smooth usage patterns. Research correlations indicate that profiles lacking natural fluctuation experience sharper degradation under external stress conditions.
Moreover, structural friction dynamics favor consistency that emerges without continuous intervention. Profiles demonstrating controlled variability often retain higher trust classifications. In contrast, behavioral recurrence patterns linked to fatigue frequently precede gradual exposure reductions. These adjustments tend to occur silently, without explicit negative events.
Interpreting Fatigue Through Analytical Modeling Aids
Understanding the transition from optimization to fatigue requires examination of maintenance cost rather than outcome metrics. AI auditors quantify how much behavioral effort a profile expends to remain within a specific classification tier. As a result, transactional metadata becomes the primary observation layer.
Analytical modeling aids available through the centralized resource hub allow observers to visualize how optimization frequency correlates with trust recalibration. These tools do not predict outcomes. Instead, they support interpretation of how boundary behavior influences probability-based auditing systems.
Structural Consistency in a Post-Optimization Cycle
As the 2026 credit cycle matures, Behavioral Fatigue Signals increasingly distinguish sustainable profiles from fragile ones. Stability now reflects structural consistency across time rather than peak metric performance. Therefore, risk classification favors profiles that absorb variance without immediate corrective behavior.
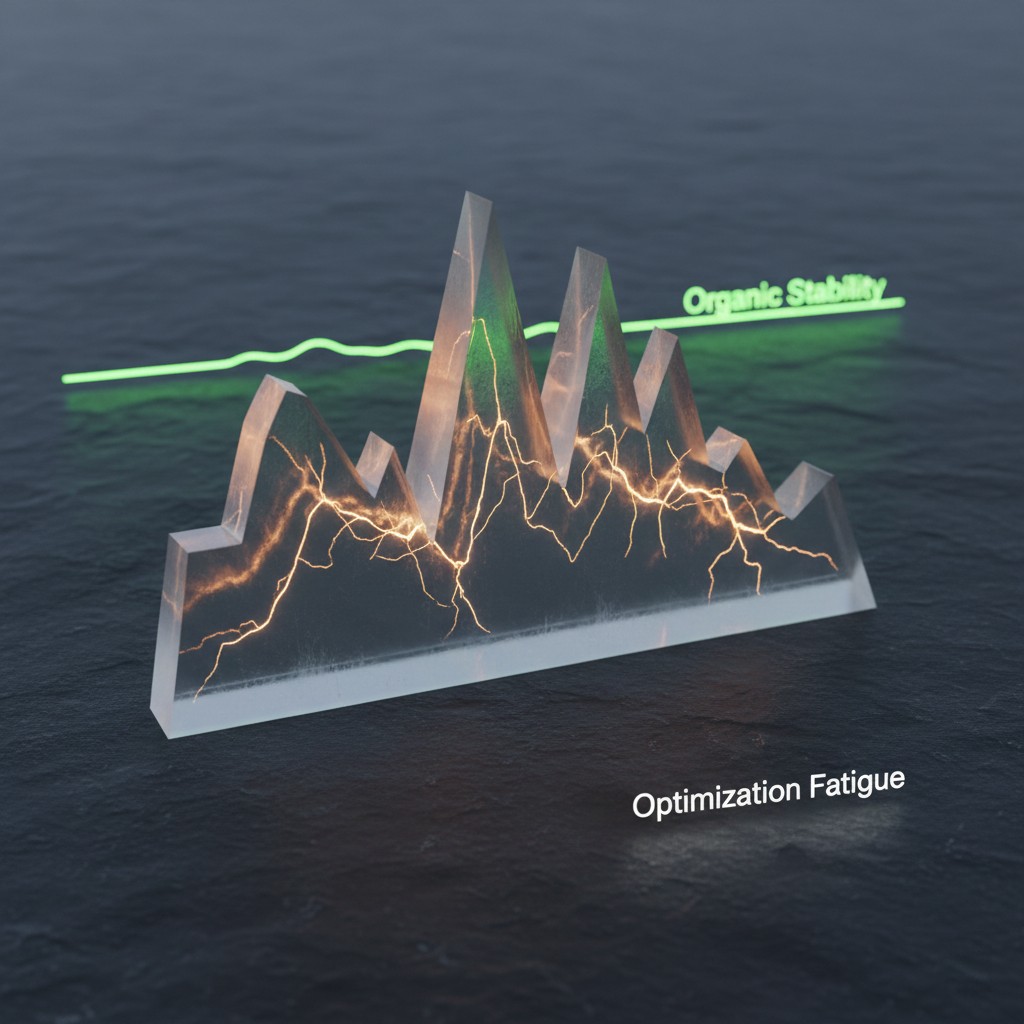
This analysis suggests that auditors assign greater confidence to predictable imperfection than to continuous optimization. Consequently, long-term classification stability aligns more closely with organic financial rhythms than with engineered precision.
This study examines Behavioral Fatigue Signals as a late-stage indicator in 2026 AI credit auditing. Findings suggest that repeated optimization correlates with elevated systemic friction, as models interpret sustained precision as structural fragility rather than financial strength.
| Profile Pattern | Observed Metadata | AI Interpretation |
|---|---|---|
| High-frequency optimization | Repeated timing precision | Elevated fatigue correlation |
| Moderate natural variation | Controlled volatility | Structural consistency |
| Low intervention pattern | Stable cash-flow signals | Lower systemic friction |
Data Accuracy Note (2026): Market conditions, Federal Reserve interest rates, and lender algorithms change rapidly. While we strive to provide the most accurate insights as of January 2026, we recommend verifying all specific loan terms and APRs directly with your chosen platform before signing any agreement.